From the perspective of resource allocation, the cluster appears relatively balanced. However, in terms of actual load, many hotspots have already emerged. This can lead to competition for shared resources between applications, causing performance interference in core business processes. As a result, application response times often exhibit long-tail behavior, leading to a decline in service quality and an increased likelihood of failures. This inter-application resource contention and performance interference (such as the “noisy neighbor” phenomenon) make application scheduling and resource management extremely complex. Therefore, it is crucial to consider how to reduce performance interference between applications to ensure business stability.

The “noisy neighbor” problem is a common phenomenon in cloud infrastructure, referring to a situation where the resources required by an application are heavily consumed by other applications on the same compute node, leading to degraded performance for the application, such as increased latency. This issue is particularly troublesome for business-critical applications but is often difficult to identify.
The root cause lies in the lack of strict isolation policies during resource sharing. From a resource perspective, this includes CPU, memory (L1/L2/L3 cache), network, and block I/O. From a hardware topology perspective, it involves CPU caches, memory bandwidth, and more. CPU cores are tightly coupled with other shared resources such as the last level cache (LLC) and memory bandwidth. If there are no effective isolation strategies in place when allocating shared resources, problems arise. For instance, sibling hyperthreads share the same physical CPU core, workloads on different physical CPU cores share the same last level cache, memory controller, and I/O bus bandwidth, and even workloads on different physical CPU sockets share CPU interconnect bandwidth, the same storage devices, or I/O bus. In such cases, the “noisy neighbor” often requires more resources and takes more time to complete the same task. This can lead to critical applications not getting the resources they need, causing performance degradation and stalls.
Kubernetes offers a CPU manager and device plugin manager for hardware resource allocation, such as CPUs and devices (SR-IOV, GPUs). Currently, Kubernetes also provides a topology manager to achieve NUMA topology awareness, coordinate resources, and ensure optimal performance for critical workloads. However, these features do not directly address the “noisy neighbor” problem.
To address this issue, the following optimization strategies can be considered:
- Resource Requests and Limits: Set reasonable resource requests and limits for each Pod in Kubernetes to ensure that applications can obtain sufficient resources during contention.
- Affinity and Anti-affinity Rules: Use Kubernetes affinity and anti-affinity rules to deploy critical applications separately from other high resource-consuming applications to reduce resource contention.
- Isolation Policies: Utilize Kubernetes CPU isolation policies to ensure that critical applications have exclusive access to specific CPU cores, reducing competition for shared resources.
- Priority and Preemption: Set the priority of applications to ensure that critical applications can obtain resources first and preempt resources from lower-priority applications if necessary.
- NUMA-aware Scheduling: Through Kubernetes topology manager, ensure that critical applications are allocated resources within NUMA nodes to maximize the efficiency of local resource use and reduce latency from cross-node resource access.
- Dedicated Hardware: For high-performance applications, consider using dedicated hardware (such as GPUs, FPGAs) or isolated physical nodes to avoid sharing resources with other applications.
- Monitoring and Adjustment: Continuously monitor the resource usage and performance of applications, and adjust resource allocation strategies promptly to ensure the stable operation of critical applications.
By implementing these optimization strategies, the “noisy neighbor” problem can be largely mitigated, ensuring the performance and stability of critical applications. Isolation policies, priority and preemption, and NUMA-aware scheduling are resource QoS optimization strategies for application scenarios. So, how do we measure performance interference?
NOTE: Mixed deployment, here “mixed” essentially means “distinguishing priorities”. Narrowly, it can be simply understood as “online + offline” (offline) mixed deployment, broadly, it can be extended to a wider range of applications: multi-priority business mixed deployment.
Technical Background
Terminology
a. CPI
CPI stands for Cycles Per Instruction, which means the number of cycles per instruction. Additionally, in some contexts, you may also encounter IPC, which stands for Instructions Per Cycle, meaning the number of instructions per cycle.
The smaller the CPI value, the higher the instruction execution efficiency of the computer system.
The relationship between CPI and IPC is: CPI = 1 / IPC
In the context of single CPU program execution performance, it can actually be expressed as:

Due to the limitations of silicon material and manufacturing processes, increasing the processor’s clock speed has reached a bottleneck. Therefore, improving program performance mainly depends on two variables: Instruction Count and CPI.
Typically, by examining the CPI value, we can roughly determine whether a compute-intensive task is CPU-bound or memory-bound:
- CPI less than 1: The program is usually CPU-bound.
- CPI greater than 1: The program is usually memory-bound.
This is just a rough estimation method. Different types of tasks may have different CPI value ranges, so it is necessary to judge based on actual circumstances. Additionally, other factors such as memory size, bandwidth, and CPU cache must be considered for a more comprehensive assessment of the task type.
A key criterion for evaluating the efficiency of a compute-intensive task is the CPU utilization during the program’s execution. Many people believe that high CPU utilization indicates that the program’s code is running intensely. In fact, high CPU utilization can also mean that the CPU is busy-waiting for some resources (not iowait), such as encountering bottlenecks when accessing memory.
Some compute-intensive tasks normally have a low CPI and good performance. The CPU utilization is very high. However, as system load increases and other tasks compete for system resources, the CPI of these compute tasks can significantly rise, leading to a drop in performance. At this time, CPU utilization might still appear high, but this high utilization actually reflects CPU busy-waiting and the effects of pipeline stalls.
Brendan Gregg pointed out in his blog “CPU Utilization is Wrong” that CPU utilization metrics need to be analyzed in conjunction with CPI/IPC metrics.
By using perf record to generate a CPI flame graph, one can show the association between the program’s call stack and CPU occupancy, and also reveal which parts of the CPU occupancy represent actual effective runtime and which parts are due to CPU busy-waiting caused by some stalls.
This tool can generally help identify system resource bottlenecks and provide ways to mitigate these bottlenecks; for example, interference from cache thrashing between applications can be resolved by binding applications to different CPUs.
Application developers can improve program performance by optimizing relevant functions. For instance, by optimizing code to reduce cache misses, thereby lowering the application’s CPI and reducing performance issues caused by memory access stalls.
b. LLC
Older CPUs had two levels of cache (L1 and L2), while newer CPUs have three levels of cache (L1, L2, and L3), as shown in the following diagram:
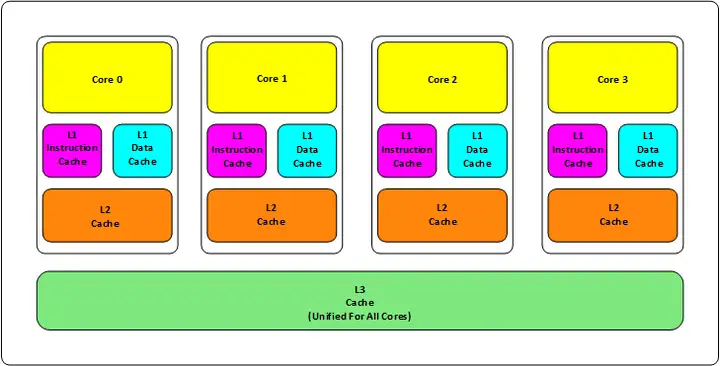
L1 cache is divided into two types: instruction cache and data cache. L2 and L3 caches do not differentiate between instructions and data.
L1 and L2 caches are located within each CPU core, while the L3 cache is shared among all CPU cores.
The closer the cache (L1, L2, L3) is to the CPU, the smaller and faster it is; the farther it is from the CPU, the slower it becomes.
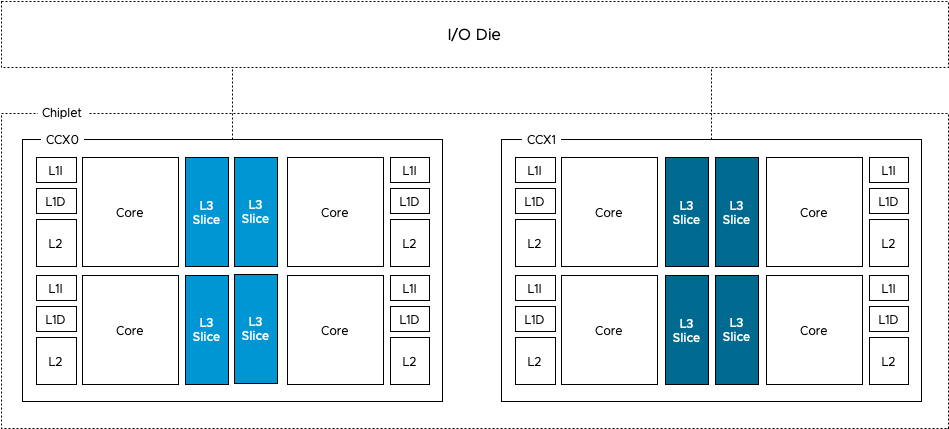
The LLC (Last Level Cache) cache resources are crucial for job performance, and interference on these resources cannot be ignored. When multiple applications share the cache, they may experience mutual replacement issues. When LLC is ineffective, the execution time of memory access instructions can increase from 15ns to 70ns. Assuming a CPU clock speed of 3 GHz, this results in each memory access instruction consuming an additional 200 or more cycles to complete. To mitigate such interference, resource partitioning techniques can be employed to physically separate multiple jobs’ access to shared resources. The diagram above shows a classic multi-core architecture where multiple CPUs share the LLC. Jobs running on different CPUs may contend for LLC resources. The Intel Cascade Lake microarchitecture and AMD’s Rome chiplet reduce inter-core competition for LLC by providing each core with its own independent LLC. However, multiple applications running on the same CPU can still experience cache replacement issues when running in a mixed deployment, necessitating application-level cache partitioning techniques. To achieve application-level cache partitioning, Intel introduced RDT (Resource Director Technology), which includes CAT (Cache Allocation Technology). CAT allows for the allocation of private cache space to processes or cgroups to avoid cache replacement.
The LLC cache hit rate and miss rate are typically calculated as follows:
- LLC Cache Hit Rate = L3_CACHE_HITS / L3_CACHE_REFERENCES
- LLC Cache Miss Rate = L3_CACHE_MISSES / L3_CACHE_REFERENCES
Here, L3_CACHE_REFERENCES represents the event counter for all LLC cache accesses, L3_CACHE_HITS represents the event counter for LLC cache hits, and L3_CACHE_MISSES represents the event counter for LLC cache misses.
It is important to note that these event counters are not simple accumulative counters; they need to be processed and normalized to obtain accurate results. Detailed processing methods can be found in the documentation for tools like pcm-exporter or other similar resources.
In a containerized environment, a streaming application running inside a container that continuously reads and writes data can consume a large amount of LLC space. This can lead to data required by an LS application running in another container on the same machine being evicted from the LLC, resulting in decreased performance for the LS application.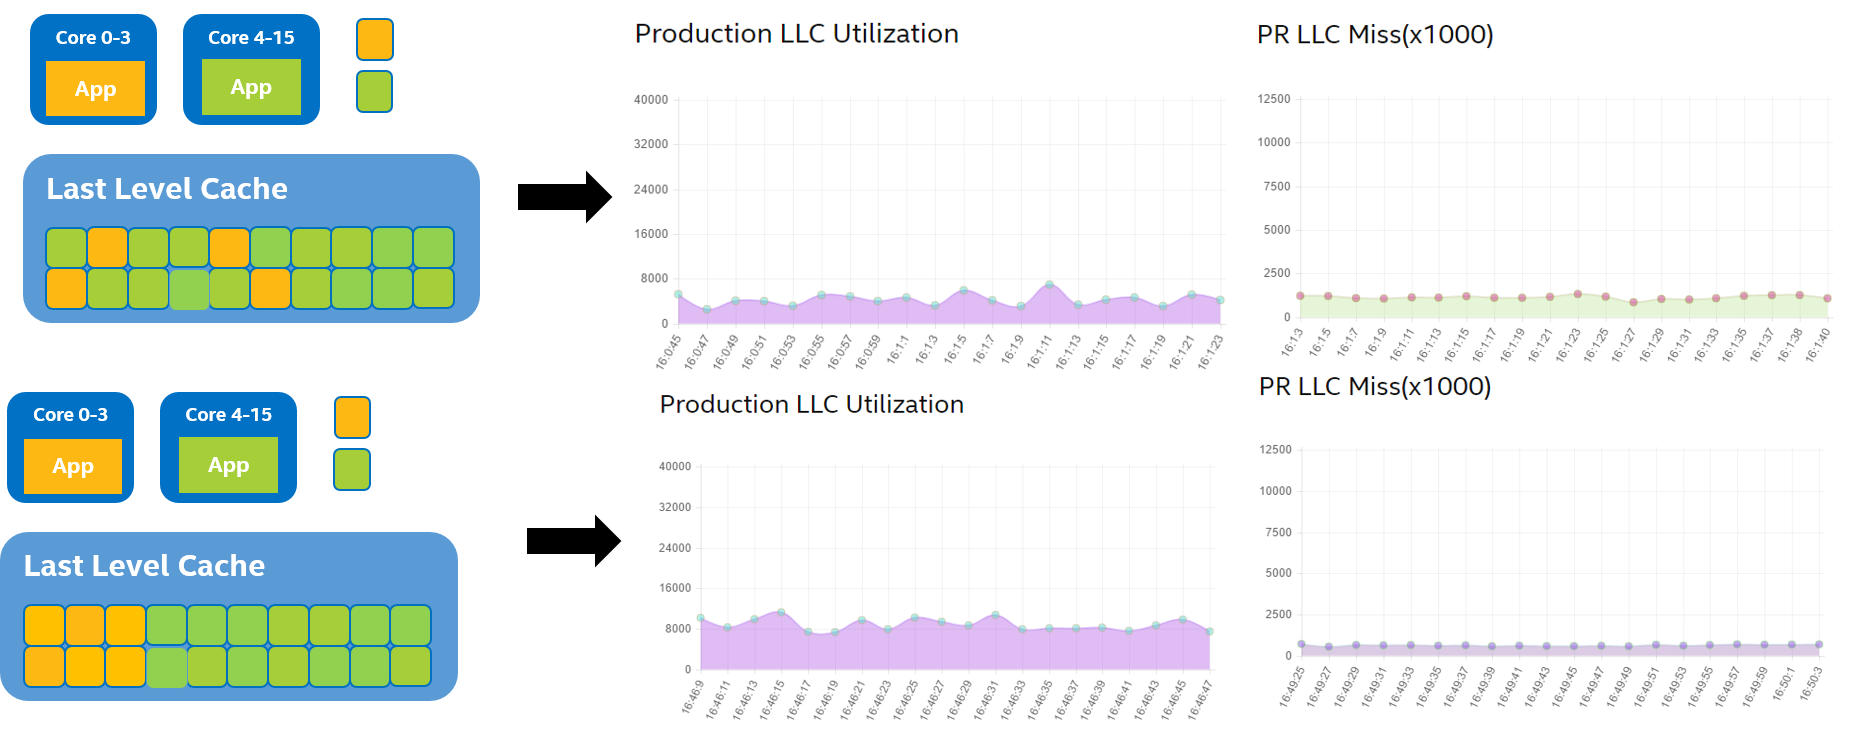
Metric Collection
Several implementation paths:
Using cgroup
perf_eventto obtain CPI metrics for all applications on the host:1
unix.IoctlSetInt(p.fd, unix.PERF_EVENT_IOC_ENABLE, 0)
Using node
perfto obtain CPI metrics for each CPU:This approach involves using Go’s implementation, which requires locking the OS and then utilizing
perf_event_open.Using cAdvisor with the
libpfmtool:This requires using cgo, with
libpfmrelying onperf_event_openat a lower level.
a. Node Exporter
Currently, node exporter only supports CPU-level metrics. For more details, refer to the implementation.
b. cgroup perf_event
This approach aims to support cgroup-level metrics, allowing monitoring of all threads belonging to a specific group and threads running on a specific CPU. For more information, see LWN.net. cAdvisor supports cgroup perf_event, and its implementation can be reviewed for details.
Other metric collection methods:
Intel RDT
Previously, solutions involved controlling virtual machine logical resources (cgroups), but this approach was too coarse-grained and couldn’t manage sensitive and scarce processor caches effectively. To address this, Intel introduced RDT (Resource Director Technology), which provides more precise control. For more details, refer to the related introduction.
RDT, which stands for Resource Director Technology, offers two main capabilities: monitoring and allocation. It enables users to directly monitor and allocate L2 and L3 caches (LLC) and memory bandwidth for each CPU core (or each logical core after Hyper-Threading) using a set of CPU instructions.
The Intel RDT implementation architecture was introduced in Linux Kernel 4.10, which provided L3 Cache Allocation Technology (CAT), L3 Code and Data Prioritization (CDP), and L2 CAT through the resctrl filesystem. Linux Kernel 4.12 further introduced support for Memory Bandwidth Allocation (MBA) for memory bandwidth management.
Intel RDT provides a series of allocation (resource control) capabilities, including Cache Allocation Technology (CAT), Code and Data Prioritization (CDP), and Memory Bandwidth Allocation (MBA).
The Intel Xeon E5-xxxx v4 series (Broadwell) offers L3 cache configuration and CAT mechanisms, with some communication-related features introduced in the E5-xxxx v3 series (Haswell). Some Intel processor series (e.g., Intel Atom processors) may support control of L2 caches. Additionally, the MBA functionality provides memory bandwidth management at the processor core level.
To use resource allocation technologies in Linux, the resctrl interface needs to be introduced in both the kernel and user space. From Linux Kernel 4.10 onwards, L3 CAT, L3 CDP, and L2 CAT are available with the resctrl architecture. Starting with Linux Kernel 4.12, MBA technology was introduced and is under development. For kernel usage instructions, see the kernel documentation.
RDT Technology Architecture
The core goal of Cache Allocation Technology (CAT) is to allocate resources based on Class of Service (COS or CLOS). Applications or individual threads can be tagged according to a series of service levels provided by the processor. This allows the allocation and restriction of cache usage based on the service classification of applications and threads. Each CLOS can use Capacity Bitmasks (CBMs) to indicate and specify the degree of overlap or isolation in service classification.
For each logical processor, there is a register (known as IA32_PQR_ASSOC MSR or PQR) that allows the operating system (OS) or Virtual Machine Monitor (VMM) to specify the CLOS when scheduling applications, threads, or virtual machines (VMs).
RDT is divided into five functional modules:
- Cache Monitoring Technology (CMT): Cache monitoring
- Cache Allocation Technology (CAT): Cache allocation
- Memory Bandwidth Monitoring (MBM): Memory bandwidth monitoring
- Memory Bandwidth Allocation (MBA): Memory bandwidth allocation
- Code and Data Prioritization (CDP): Code and data prioritization
RDT technology targets caches and memory bandwidth, divided into monitoring and control, forming four functional modules. Adding Code and Data Prioritization (control technology) results in a total of five functional modules.

After enabling RDT control, you can create user directories in the root directory (e.g., “CG1” and “CG2”, as shown in Figure 4: Intel® RDT Hierarchy in the resctrl Filesystem) and specify different levels of control for each shared resource. The RDT control groups include the following files:
- “tasks”: Reading this file displays a list of all tasks in the group. Writing task IDs to this file adds tasks to the group.
- “cpus”: Reading this file displays the bitmask of logical CPUs owned by the group. Writing a bitmask to this file adds CPUs to the group or removes CPUs from the group.
- “schemata”: A list of all resources accessible by the group.
After enabling RDT monitoring features, the root directory and other top-level directories will include a “mon_groups” directory, where user directories (e.g., “M1” and “M2”, as shown in Figure 4: Intel® RDT Hierarchy in the resctrl Filesystem) can be created to monitor task groups. The “Mon_data” directory contains a set of files organized by resource domain and RDT events. Each directory within “Mon_data” has files for each event (e.g., “llc_occupancy”, “mbm_total_bytes”, and “mbm_local_bytes”). These files provide counters for the current values of events for all tasks in the group.
Theoretical Foundation
CPI2: CPU Performance Isolation for Shared Compute Clusters
Performance Metrics
CPI
Core Methodology
Google’s approach relies entirely on statistical analysis based on historical data, without requiring separate stress testing, making the method straightforward. Google demonstrated the correlation between CPI and RT (Response Time) using historical data, finding a correlation of 0.97 for leaf-level links primarily for CPU-bound applications. Other services, such as some I/O-bound services and intermediate node services, still showed a correlation above 0.7. Thus, CPI was confirmed as a valid proxy for performance.
Online jobs are typically long-running tasks, and their CPI trends on the same CPU model usually follow a predictable pattern. Therefore, traditional sliding window prediction methods are used to forecast the CPI for the next period.
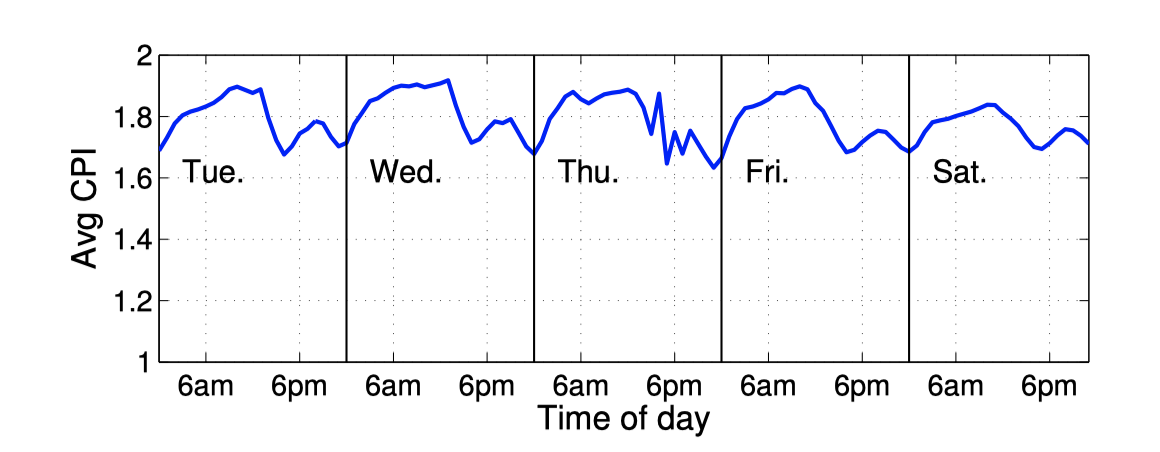
Furthermore, the distribution of CPI data remains relatively consistent day-to-day, allowing the use of statistical methods to calculate the average CPI (CPIavg) and standard deviation (stddev) from the previous day. A threshold is set at CPIavg + 2 * stddev; if the CPI exceeds this value, QoS (Quality of Service) is considered to be impacted. Additionally, to avoid false positives, the rule requires that this threshold be exceeded three times within a 5-minute window before determining that QoS is affected.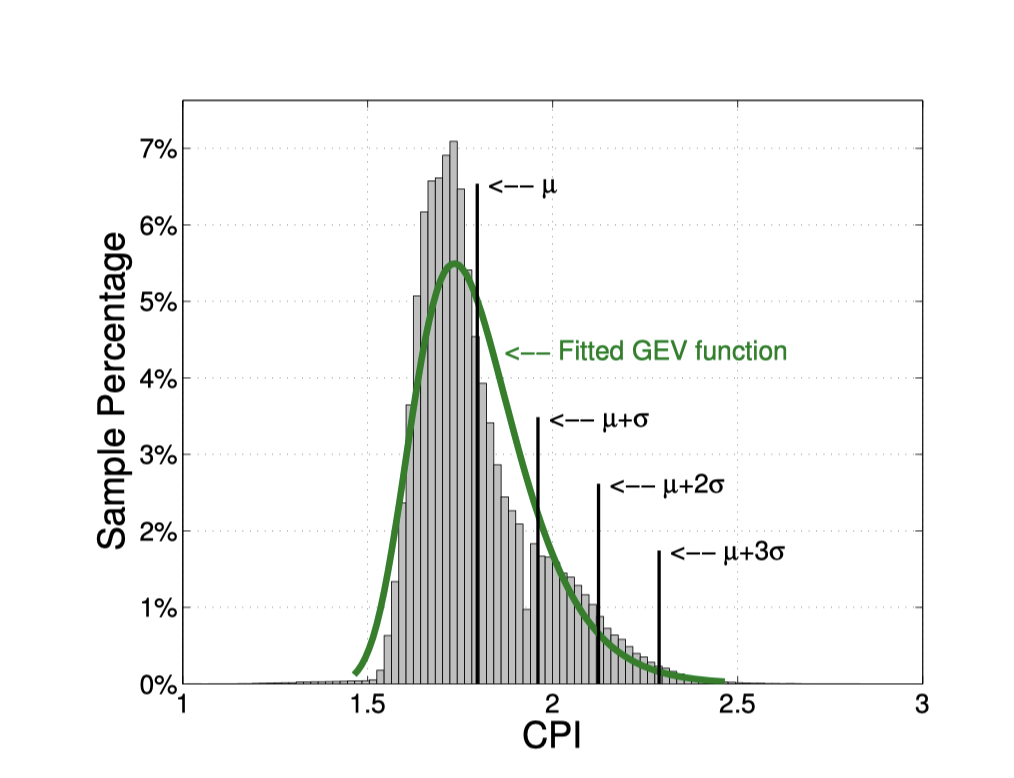
Conclusions
Experimental data indicate that the linear correlation coefficient between CPI and interference is 0.97.
LIBRA: Clearing the Cloud Through Dynamic Memory Bandwidth Management
Performance Metrics
CPI
Core Methodology
The primary contribution of this article from Alibaba is in how to adjust LLC (Last Level Cache) more finely. Intel RDT provides two technologies—CAT (Cache Allocation Technology) and MBA (Memory Bandwidth Allocation)—which are similar to cgroups in usage. Due to the slow integration into container runtimes, Intel open-sourced intel-resource-manager to support these technologies. CAT isolates LLC size, while MBA isolates L2-L3 memory bandwidth. However, the adjustment granularity for these two dimensions is 10%, which is too coarse. Alibaba combined CAT and MBA to achieve finer-grained adjustments.
In this approach, CPI is used for interference detection, but Alibaba calculated it through stress testing. They established a linear relationship RT = k * CPI + l to relate RT (Response Time) to CPI. Real-time CPI data is then used to estimate RT values and assess whether application QoS exceeds SLA (Service Level Agreement).
Conclusions
CPI is linearly related to interference. By calculating RT from CPI, adjustments to LLC and MBA can be made to manage resource isolation effectively.
PARTIES: QoS-Aware Resource Partitioning for Multiple Interactive Services
Metrics
Latency (ms)
Core Methodology
Stress testing is used to determine the optimal latency target QoS for single applications (by applying pressure until the latency-pressure curve shows an inflection point). Resources are categorized as <cpu core, cache way, cpu frequency, memory space, disk bandwidth>, with corresponding adjustment granularity of <1 core, 1 way, 100 MHz, 1 GB, 1 GB/s>. QoS is checked every 500 ms, and if deviations from target QoS are detected, resources are adjusted. For each application, different resource adjustments are attempted each round (similar to guessing the resource causing interference) until the QoS for all applications on the machine is ensured. The article provides a good approach by treating resources as interchangeable. For example, when interference is detected, resources are not uniformly scaled up or down; instead, resources are exchanged, such as reallocating CPU from I/O-intensive applications to CPU-intensive ones, ensuring that each application has the appropriate resources.
Due to the author’s limited time, perspective, and understanding, there may be errors or omissions in this article. Feedback and corrections from readers and industry experts are welcomed. The troubleshooting information above has been updated to reflect community content.
Reference
- Caelus—全场景在离线混部解决方案
- Google Borg 2015:https://research.google/pubs/pub43438/
- Google Borg 2019:https://dl.acm.org/doi/pdf/10.1145/3342195.3387517
- Google Autopilot:https://dl.acm.org/doi/pdf/10.1145/3342195.3387524
- 百度千寻:百度大规模战略性混部系统演进
- 阿里伏羲:https://yq.aliyun.com/articles/651202
- 阿里k8s混部:https://static.sched.com/hosted_files/kccncosschn19chi/70/ColocationOnK8s.pdf
- CPI论文: https://static.googleusercontent.com/media/research.google.com/zh-CN//pubs/archive/40737.pdf
- Heracles论文:https://static.googleusercontent.com/media/research.google.com/zh-CN//pubs/archive/43792.pdf
- Bubble-up论文:https://ieeexplore.ieee.org/document/7851476
- Linux kernel perf architecture (terenceli.github.io)
- resolving noisy neighbors (intel.com)
- Maximizing Resource Utilization with cgroup2
- 字节跳动:混布环境下集群的性能评估与优化
- 混部之殇-论云原生资源隔离技术之CPU隔离(一)
- CN106776005A - 一种面向容器化应用的资源管理系统及方法
- 阿里K8s之动态解决容器资源按需分配
- 混部场景下的单机服务质量保障
- [Cache高速缓存和缓存隔离](https://lynnapan.github.io/2017/04/18/understand Cache/)
- hodgesds/perf-utils
- 用CPI火焰图分析Linux性能问题
- openEuler资源利用率提升之道
- 在离线混部作业调度与资源管理技术研究综述
- 从混部到统一调度